By Shawn Lemaster
February 25, 2018
We were surprised by recent surveys and discussions on plotting UTM points for races… the results say most of you actually like doing it! So by popular demand, we’ve been including this element in our longer races.
If you need to brush up on your plotting skills (or learn completely from scratch) here you go.
Mark Lattanzi nails it perfectly in his new book Squiggly Lines. This is pretty much the bible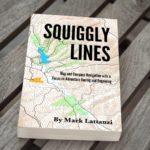 of navigation for AR, so check it out if you don’t already have it. If you do have it, flip to page 30, read three pages, and you’ll be a near-expert.
Let’s summarize how you’ll actual plot points for our races though.
First things first. You’ll need a UTM Plotter. Most ARs require a 1:24,000 scale plotter (this is the scale you’ll be using for our races). There’re two styles, Slot and Corner. Both work well, it’s just personal preference; some find the slot style a little quicker.
With plotter in hand, you’re going to receive your race map(s). These maps will have a UTM grid overlaid on them with each square equaling 1 kilometer. Along the edges, you’ll see the actual UTM coordinates for each easting line (the lines running up & down along the Y axis) and each northing line (the lines running left to right along the X axis). So, here are examples of both the Race Map and UTM Coordinates you’ll receive. Let’s try plotting the Start/Finish to the LBL Challenge this year.
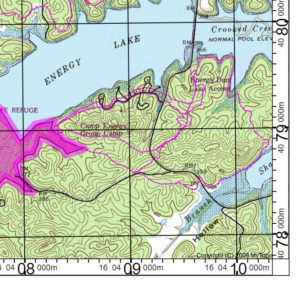
 Look at all those numbers! Don’t worry, you only need a few. When we race, our team actually crosses out the extraneous digits on the UTM Sheet, so there’s no confusion. Also note that the digits to start with are actually larger in the image of the coordinates above (09 and 79) making it even easier to know which ones to start with. Now we’re ready to plot this point on the actual map.
First, just find the grid square the point is in.
UTM 16S 04 09064E 40 79417N
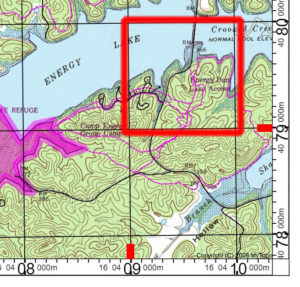
Second, put the upper right corner of your plotter tool on the lower left corner of the correct grid square (just make sure you’re using the right scale on your tool, 1:24,000).
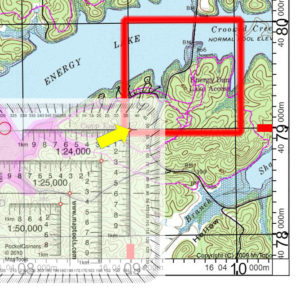
Third, slide the plotter right until you reach the correct easting. This one is 06, so it’s just 60 meters off of the line. 64 meters if you want to get really precise, but for our purposes, not trying to plot with that level of accuracy is precise enough for this scale map.
UTM 16S 04 09064E 40 79417N

Fourth, slide the plotter up until you reach the correct northing. This one is 41.
UTM 16S 04 09064E 40 79417N
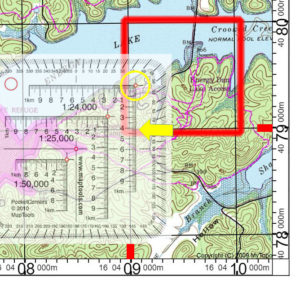
Finally, mark the checkpoint! Now you know where the start of the LBL Challenge is.
Pro Tips
- Using the Slot style tool saves you the step of moving the tool up for the northing, you simply mark it through the slot.
- If you have a teammate, it works very well for one person to read the digits to the person plotting. For the example above, “grid square 09, 79” gets them in the right square. “06,41” lets them plot the point. We like to have the person plotting guess the feature to verify it’s correctly placed, “hilltop”…”yep”.
- The more races you do, the more formats you’ll see UTMs written in. For the example above, it could be written as 409064,4079417 (zone and leading zero removed). A typical format for adventure races would be 409060E,4079410N (leading zero removed and last digit truncated). Regardless, plotting remains the same.
now you know, happy plotting

